Refreshing report data through View Report button

In Reporting Services we already have a refresh button:

refresh-button

which refreshes the displayed report data. Users, though, tend to click the View Report button instead and it is sometimes necessary to enforce a data refresh every time a user clicks on View Report.

Normally, the View Report button should be used when a report user changes the report parameters and Reporting Services will try to retrieve data from the data store after clicking it only if some parameter value has changed.

Using this knowledge, we can set up a dummy internal parameter which changes its value constantly. If we want to make sure the report value changes, we can build a datetime parameter with available and current value of Now() – which returns the current date and time and will always be different between clicks on View Report.

A possible issue with this way of enforcing data refresh is that the report cache will never be used, thus possibly causing a performance problem. However, if performance is less desirable than avoiding the need to educate our users this report “hack” may be quite useful.

Comments Collection – a simple implementation

In order to have comments on a report we need to ensure we have a comments storage place (a database table) and an user interface (an asp page). I will skip the explanation of how to build and integrate the asp page in our reports because I have already discussed javascript in Advanced javascript in Reporting Services, while building an asp comments collection page is outside of the scope of this blog and is a fairly simple task for any .NET developer.

Having provided the prerequisites, the way our report will behave is very simple – it will pass to the asp page the location of the node against which the comment is entered, which in turn will call a stored procedure which will update the comments table.

The following graph illustrates this set-up:

comments_graph

Our comments table has to be built after considering the grain of the nodes against which we store comments. Our users may require the ability to comment against fact values on any level of our hierarchies – including aggregations. In order to allow for maximum flexibility we may need to have a table which mimics our fact table structure but instead of facts values stores comments.

Also, we need to build two stored procedures – one to update our comments table and another one to retrieve the comments we want to display on the reports. These are similar in every way but the action they perform. Each of the stored procedures has to accept our dimension coordinates as parameters – most likely the dimension keys – in order to be able to correctly store or locate the table value which it needs to update or select.
There are some other considerations we need to keep in mind:

  • Unfortunately, Reporting Services does not allow us to have report items which are dynamically updated, so it is not possible to have the comments to get displayed without refreshing the report data.
  • If two report users simultaneously try to comment on the same issue the .NET code must be able to resolve the contention issue caused by the “commentators”.
  • Data storage may be a problem as users are usually reluctant to set a limit on the length of the comments.

Adding comments to our reports is simple and easy and should not cause too much headache if it is designed well. It is a very desired functionality on most reports as these are generally shared by many users, who can be responsible for different report items and need to be able to explain the report contents to their peers (especially when forecasting and planning is involved).

Amendment 1 (2008-10-13): In a conversation with a colleague who has recently implemented a comments collection solution, I came across the idea of having the comments stored in a dimension comments table, then mapped to the already described fact table mock-up. The reason for separating the comments through a mapping table is the reduced storage in case the same lengthy comments are used against multiple dimension coordinates (in her project – rolling over comments periodically).

Colourful reports with no pictures – use of alternative fonts

When constructing a Reporting Services report we have the option of using pictures to illustrate a concept – and Edit button can look like a pencil, traffic lights usually are presented with small icons, a print button can show a small printer. While in PerformancePoint we must use small pictures to show these, in Reporting Services we can also use alternative fonts in the Microsoft fonts library. Standard Microsoft options are the Wingdings and Webdings font families. Using them we can construct horizontal bar graphs, traffic lights and various other icons. The positives with doing that are: seamless exporting to PDF and Excel, easy change of an icon throughout all reports – both of its appearance and colour and easy synchronisation of colours between various report icons.

Examples of report items using Wingdings are:

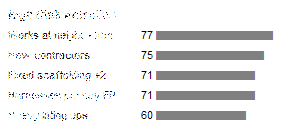
Horizontal Bar Graph:
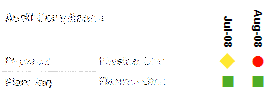
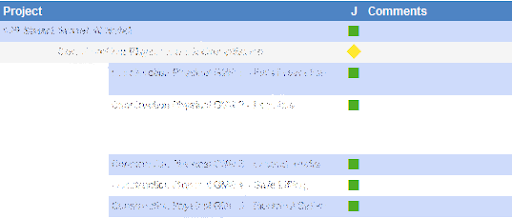
bar_graph_wingdings

Traffic Lights:

tlights_wingdings

tlights_2_wingdings

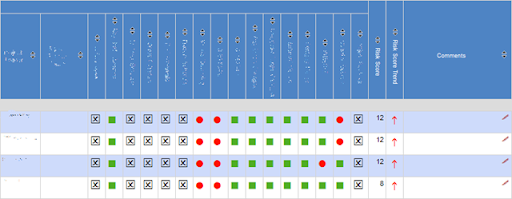
Combination of icons, traffic lights and trend arrows:

combined_indicators

All of the examples above use Wingdings and Wingdings 2. The definition of the characters, fonts and their colours are stored in control tables, thus they are easily modified without altering the reports.

The first example shows a dynamically generated bar graph where the length of the character string corresponds to the numbers displayed to its left. The largest number fills up the entire table cell, and as it gets smaller, the number of Webdings characters proportionally reduces.

The second and the third reports utilise Wingdings and Wingdings 2 to display colour-blind friendly traffic lights.

The third report fragment illustrates a combination of traffic lights, risk trend arrows and edit characters (pencils icons), all of which use conformed colours, easily synchronised and easily interchangeable. The colour of the upwards trend arrow, in example, is exactly the same as the one used for the red traffic light.

There are a few considerations when using these fonts.

Firstly, only Wingdings and Webdings come with a standard Windows installation, while Wingdings 2 and Wingdings 3 are packaged with Microsoft Office. This is important as the report users need to have all report fonts installed on their computers so that their browser can render them. Also, if we want to allow for printing and exporting the reports to PDF or Excel the fonts must be installed on the Reporting Services server instance as well. Provided we can guarantee this set-up all of the described functionality is seamless for the report users.

Using blank ASCII character in PerformancePoint to avoid trimming

Recently I had a problem with a PerformancePoint filter, which got automatically trimmed. The filter was displaying a small custom cut of a hierarchy and the Business Analyst on the project wanted to see it always expanded in a simple single select drop-down instead of in a tree. The tree view was undesirable because the hierarchy was very small and clicking twice to get to the third level was too much for the users of the reports.

Unfortunately, indenting the drop-downs with blank spaces is not possible when using a List filter as PerformancePoint trims the items in it providing a flat list of names. Indenting with dashes or some other visible character is also usually not visually pleasing, and since there is no way to use rich text and color some of the characters in white, the only option is to use an invisible character which does not get trimmed.
Fortunately, there is such a character with an ASCII code of 255. It is a space-like character, which does not get trimmed by PerformancePoint in a List filter. Therefore, if we indent our list with ASCII-255 characters we achieve the goal of having nicely arranged list in a simple filter. Keeping Alt pressed and then typing 255 from the numeric keypad results in typing one such whitespace character.
As it is generally not a good practise to use the character in our code as distinguishing it from a space is not easy, it is advisable to provide a lot of comments around code fragments utilising it, including the way to type it.