7 Tools You Want on Your BI Dev Workstation

Without promising gimmicks like 80% reduction in development effort and time to deliver (as if…), the following tools are either free or relatively cheap and offer a productivity boost while allowing (and actually in some cases promoting) good development practises. Of course there are many others available but the following are my personal preferences, which I have found to be particularly valuable while developing (in no particular order).


BIDS Helper

When it comes to free tools for Microsoft BI development BIDS Helper usually tops the list. It is a very powerful tool making many advanced development tasks easy.

Who makes it: Darren Gosbell, Greg Galloway, John Welch, Darren Green, Scott Currie
License: Free
Link:
http://bidshelper.codeplex.com/


SQL Compare and SQL Data Compare

Red Gate is renowned for their great products and the top two in my opinion are SQL Compare and SQL Data Compare. These two allow robust and simplified migration between environments and help with creating transactional scripts for deploying to servers guarded by zealous DBAs.

Who makes it: Red Gate
License (1 Developer): SQL Compare (Standard) – $395; SQL Data Compare (Standard) – $395
Trial: Yes
Links:
http://www.red-gate.com/products/sql-development/sql-compare/
http://www.red-gate.com/products/sql-development/sql-data-compare/


BI Documenter

For those who do not like writing lengthy documents describing their work Pragmatic Works offers a great tool which extracts metadata from the various BI components in a solution and organises it very neatly in a cross-referenced (think HTML links between pages) fashion. It does it so well that I have had clients completely satisfied in terms of documentation by its output.

Who makes it: Pragmatic Works
License (1 Developer): $395
Trial: Yes
Link:
http://pragmaticworks.com/Products/Business-Intelligence/BIDocumenter/Default.aspx


AS Performance Workbench

For load testing of SSAS instances and cubes the free AS Performance Workbench provides a simple, easy and visual interface and eliminates the need to create a complex testing framework.

Who makes it: Rob Kerr
License: Free
Link:
http://asperfwb.codeplex.com/


ASCMD

ASCMD is for SSAS what SQLCMD is for SQL Server – a command-line utility allowing execution of XMLA and MDX scripts. It provides a rich set of functionality for performing maintenance and testing tasks.

Who makes it: Microsoft
License: Free
Link:
http://msftasprodsamples.codeplex.com/


MDX Studio

Started by Mosha Pasumansky, MDX Studio is the most powerful MDX analysis tool available. It provides best practise advice and includes many MDX tuning features not available in the toolset included in SQL Server and Windows.

Who makes it: Microsoft
License: Free
Link:
http://cid-74f04d1ea28ece4e.skydrive.live.com/browse.aspx/MDXStudio/v0.4.14


Team Foundation Server

TFS is a must if development is done by more than one person. While merging changes in BI projects is not as useful (or even possible) as in .NET coding projects, maintaining versions, branching, etc is still a must. TFS also includes bug tracking, requirements management, and a bunch of other features well worth exploring.

Who makes it: Microsoft
License: 5 Developers – $499
Trial: Yes
Link:
http://www.microsoft.com/visualstudio/en-us/products/2010-editions/team-foundation-server/overview

SSIS Balanced Data Distributor – Comparison

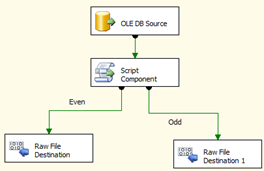
Microsoft just released a new Data Flow transformation for SSIS – Balanced Data Distributor. Reading the installation pages, we can see that there are a few interesting things about it, among which – it is a multithreaded transform, which uniformly splits a data stream in multiple outputs. I decided to give it a quick test and see how it performs in comparison to a straight insert and a Script Component which splits the input stream in two, as well.

First the tests show performance with input of a SQL Server table (OLE DB Input) and output to a raw file. The input is a TOP 20000000 * select from a large table. The results are as follow:

1. Straight insert: 32 seconds

2. Balanced Data Distributor: 36 seconds

3. Script Component: 57 seconds

4. Conditional Split: 42 seconds


Note that the Conditional Split divides the stream based on the remainder of a division of an integer field, while the Script Component does it based on the row number. The Conditional Split may or may not be useful in a number of cases – when we have non-numeric data only, or when the range of the numeric data is not wide enough to split in the number of streams we would like to (e.g. Gender Key can be 1 or 2, while we may want to split in 10 parallel data streams). Therefore, its functionality is not equivalent to the BDD transform (thanks to Vidas Matelis for asking me to include it in the case study).

The second tests show how fast it is with reversed input and output (raw file to SQL Server table) and everything else identical.

  1. Straight insert: 56 seconds
  2. Balanced Data Distributor: 1 minute and 47 seconds
  3. Script Component: 1 minute and 57 seconds
  4. Conditional Split: 1 minute and 54 seconds

Over 40M rows the difference between the BDD transform and the Script Component – 1:16 vs 2:13 (vs 1:24 for the equivalent Conditional Split), or 57 seconds difference when inserting in a raw file. In general, the overall performance improvement seems to be around 35-45% in that direction. Since I am inserting in my local SQL Server in the same table the parallel split does not seem to be beneficial even though the destination is slower than the source. In fact the straight insert outperforms the parallel data flows in both cases. If we were to insert into a partitioned table over different filegroups hosted on separate drives the results could be quite different. Either way, in my opinion it is a nice and welcome addition to our arsenal of SSIS data flow components.

Edit: Len Wyatt from the SQL Performance Team at Microsoft has provided a link to his post with great bit of detail about the BDD transform in the comments below. Please take a minute and have a look if interested.

Tip: Deployment Options in BIDS

The default options in BIDS do not always make perfect sense and one of the annoying defaults for me is the configuration of deployment options for a SSAS project. If we create a new project and then check its properties we see the following under the deployment tab:

By default the Processing Option is Default (surprise!). We also have two other choices:

In most cases we do not want to process the deployed database after a change has been made but by default BIDS will send a process command to SSAS whenever a process is required to bring the objects which are modified up. If we change the Default to Do Not Process we avoid this and the project gets deployed only.

The relevant MSDN page states:

By default, Analysis Services will determine the type of processing required when changes to objects are deployed. This generally results in the fastest deployment time. However, you can also choose to have either full processing or no processing performed with each deployment.”

I beg to disagree – I do not believe that it results in fastest deployment time. In fact it is just between Do Not Process and Full Process when it comes to deployment time only.

The default can be particularly annoying when we really want to only deploy and we right-click on the project and click Deploy while developing but we almost always get a partial process after a structural change. I have seen developers clicking Process instead, waiting for the deployment to finish (no automatic process if we do this) and then quickly pressing <Esc> to cancel the processing afterwards. Not a major breakthrough, but may optimise a bit the way we work, so I thought it may be a good idea to put this little issue in the spotlight for a moment.

SSAS to BISM – Recent Developments

There was a fair bit of FUD around the future of SSAS and just now it got officially dispelled by both TK Anand’s and Chris Webb’s posts on the roadmap ahead of SSAS. If you haven’t read these I would definitely recommend a thorough read through both (yes, TK’s is a bit long, but we did need all of it).

After the confusion has been more or less sorted out, a brief summary could go along the lines of: “We just got an enhanced SSAS“. I have been asked a number of times about the future of SSAS and UDM. So far I seem to have gotten it right – we don’t get a tremendously successful product replaced – instead we get a new and exciting addition to it. Rumours have it that the SSAS team will soon get down and dirty with more work on all of the components of SSAS – both multidimensional and tabular. What can come out of this? – a unique mix of on-disk and in-memory analytics. Edges may have to be smoothened, and in the end of the day we get more, not less.

What caused the confusion – well, in my opinion the SSAS team may be the greatest in analytical tools but in this particular case I think that the communication from Microsoft to us was not up to par. In all of their excitement about the new toys they are building for us they did not accurately draw a roadmap, which lead to the rumours. I hope that in the future this won’t happen and the recent posts by the SSAS team show a lot of improvement in this regard.

All in all we get a BI Semantic Model – encompassing both multidimensional (previously known as UDM) and the new tabular (in-memory) modelling. These two are integrated in one BISM, which allows us to pick and choose the tools we need to deliver the best possible results. All other tools in the stack will eventually work equally well with both models and the two models will integrate well together. Of course, this is a big job for the team and I hope that they succeed in their vision since the end result will be the best platform out there by leaps and bounds.

As of today – the future looks bright and I am very pleased with the news.

Dynamic Groups in SSRS Reports with MDX

Providing a dynamic group in SSRS with SQL is not all that hard. It is also a common business requirement when combining reports. In example, I see very often an old system providing multiple similar reports to its users – that is reports with exactly the same layout but with different items on rows or columns. I also see quite often SSRS requirements asking me to mock the old functionality and build multiple almost identical reports. My personal preference is to combine them in one if possible, thus reducing the maintenance and even development effort and cost. In SQL we have the convenience to choose how to name the output columns. As long as we have a stable dataset – that is a constant number of columns with the same data types called the same way, SSRS does not differentiate between them and treats them the same way. This allows us to flexibly change their actual contents. The standard approach in MDX would be to create all possible “groups” in a large dataset and then use one or another in the report as required through expressions. This, however, leads to slower execution times, larger chunks of data going around the network and the need to aggregate within SSRS at almost every data cell.

Instead, we can build the same functionality by constructing MDX dynamically through the use of parameters. Let’s examine a practical case to illustrate the concept a bit more clearly. If we assume that the Adventure Works executives asked me to create two simple reports showing years across the columns, their Internet Sales Amount in the data area and on one of them product categories on rows, while on the other one – the countries from which the sales originate from. The layout would be the same – a tablix, which has one column group – Year (calendar), Internet Sales Amount in the data cell and one of the two dimension hierarchies (Product Category or Country) on rows. The MDX for the datasets would also be fairly similar:

Year

Country

As we can see, the only difference here is the set on rows. Instead of providing two reports we can combine them in one. The standard approach I see all developers implementing is crossjoining all sets together and then aggregating in SSRS. To switch between the two grouping fields there would be a parameter “Group By”. The sample MDX for this report would be:

And the layout in SSRS:

The row group (and the expression within the row cells) here is based on a GroupBy parameter with two values – “product” or “country”. In SSRS the expression for them looks like this:


When the user selects Product as a value for the Group By parameter, our report renders grouped with the Product categories on rows. In this particular case the dataset is relatively small even when we do a full crossjoin between years, product categories and countries. However, in many cases the number of items on rows can be prohibitive. Therefore, it is better if we can avoid doing this by dynamically constructing the MDX expression. We can add another (Internal) parameter – GroupMDX to our report with the following expression as its default value:

Then, we can replace the report dataset with the following MDX:

To make it execute, I added as a sample query parameter GroupMDX with a value of [Product].[Product Categories].[Category]*[Customer].[Customer Geography].[Australia]. Note that you should use the same hierarchies as sample parameters as what you are actually using in your MDX parameter – otherwise you will get empty results (e.g. if I were to use [Customer].[Country].[Australia] as a sample in this case the actual dataset would not be able to figure out that the hierarchy has been changed and will return an empty set on rows for country).

Unlike with SQL, though, we have a problem – every time the query executes with a different set as a parameter value it returns different result set and its fields collection does not link well to them:

Luckily, there is a workaround. We can add a bit of custom code to our report (Report Properties -> Code). For more details you can read the following MSDN article. In a nutshell, we can check in the custom code for missing fields, thus guarding against the error we are receiving. The slightly modified code snippet from the MSDN page is:

Now, we can wrap every possibly disappearing fields reference within our report with a call to the function. In our case, we can replace the row group expression, as well as the row cell expression with the following expression:

Now we can run our report and get the results we expect. Every time we change the Group By parameter and run the report, SSRS constructs a different MDX query and sends it to SSAS getting only the results it needs. It is a fiddly technique, but in many cases can be a lifesaver – in particular when the large crossjoin method is just too slow.

And the report rdl can be downloaded here: [listyofiles folder=”wp-content/DynamicGroups”]