We can easily build ranges in MDX with the range operator “:”. We can also easily create a Range dimension in SSAS and use it to slice our data. This post is not about either of those. I would like to discuss the scenario where we need to restrict an ad-hoc query (e.g. PivotTable in Excel) by a range of values. Usually, we would tell our users to just select the values they need. This works. However, if our users do not want to be selecting/deselecting many values, we can provide an easier way to do this.
Let’s assume we have an Age dimension for a Kindergarten cube. The Age dimension contains the ages of the children, which can be from 1 to 10. Our requirement is to be able to select low and high limits of ages for a Pivot Table in Excel, so that the data in the Pivot Table is sliced for the range of ages between those limits.
To implement this in practise, we can build two extra dimensions – Age – Low Limit and Age – High Limit, which contain the same members as the Age dimension and then use them to slice our cube. Because the data is the same for all three dimensions, we can use a couple of database views on top of the Ade dimension table, thus ensuring that all three are in sync:

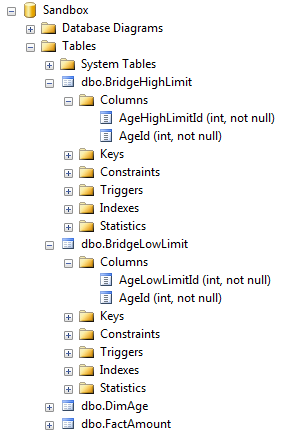
After that, we build two bridging tables BridgeLowLimit and BridgeHighLimit between Age and Age – High Limit, as well as between Age – Low Limit:

The data in these Bridging tables maps each Low and High limit to all Age members which are either lower (for High limit) or higher (for Low Limit) than the limit members:


Now, we can define many-to-many relationships between the FactAmount (our fact table), through the Age dimension and the Bridging tables to our limit dimensions as follows:


After this, we can hide the two measure groups for the Bridge tables from the users:


Now, we are ready to process our SSAS database. After that, we get the following in Excel:

If we place the Low and High limits in the Report Filter, Age on rows and our Amount measure on columns we can limit the Age members displayed by changing the filter members. Note that only the lowest member in the Age – Low Limit dimension and the highest in the Age – High Limit dimension matter – everything in between those (in case of multi-selects) effectively get ignored.

There are certain problems with this solution. If we place the limit dimensions on rows and we select multiple members from each dimension, we get the following:

This can be confusing for the users if they want to get distinct ranges like 1-3, 3-6, 6-10. Unfortunately, it is not possible to build a cube calculation which hides the irrelevant members as we do not know what the users have selected in Excel. From there, we cannot determine what members are in the query scope, and from there, we can’t pick only the ones we need (e.g. the ones with the lowest distance between the two limit members).
If we place the two dimensions on Rows and Columns, we can get a nice matrix and this makes a bit more sense:

Also, for large dimensions (e.g. Date), this can be quite slow, as the number of rows in the Bridge tables will grow. In example, if we have 10 years in our Date dimension, and we map them the way I just showed we will end up with approximately 6-7 million rows in each Bridge table, which can be quite prohibitive from performance point of view. However, for smaller dimensions (in my opinion everything under 1000 members would be ok as it would generate approximately up to 500,000 rows in each Bridge table). Therefore, if our users insist on this functionality – especially when they have a flat list of 100-1000 members, and they frequently select ranges out of this list – we have a way of answering their need.


You must be logged in to post a comment.